Subscriptions Dashboard Overview
- DarkLight
Subscriptions Dashboard Overview
- DarkLight
Article summary
Did you find this summary helpful?
Thank you for your feedback
Your Subscriptions Dashboard provides a detailed view of how subscriptions are performing.
In this article, you’ll learn how to read and use the dashboard to make data-driven decisions and improve your subscription strategy.
How it works
Your dashboard is located under Analytics > Overview. Data can be filtered by specific products, variants, and dates. The latest update time is displayed at the top of your report.
The data in the dashboard is shown in the currency selected on your Shopify store.
Revenue from subscriptions
This section displays gross revenue, including subscriptions, recurring purchases, and add-ons.
All metrics define Orders as any order containing at least 1 subscription product, including both new and recurring orders. Each section also shows the number of orders for that metric type. The selected time frame is compared to the previous equal date range.
Each section also includes Average revenue, which shows the average amount of revenue for each of the metrics (Gross, New, Recurring, and Add-Ons).
Revenue is broken down into four main metrics:
| Metric | Description |
|---|---|
| Gross revenue | Includes income from all subscription-related sales. This includes:
Please note: Gross revenue does not include any deductions from taxes, discount codes, shipping rates, and duties |
| New revenue | This is calculated by the total price of products times the number of new subscription orders. Includes subscription-related product sales in:
|
| Recurring revenue | The total price of products multiplied by the number of recurring subscription orders |
| Add-ons revenue | Income generated from items added onto subscription orders during the selected date range |
Performance over time
The Performance over time chart represents the daily breakdown of your revenue, orders, and average revenue.
Selecting the Revenue type (New, Recurring, or One-Time) will show data for only that revenue. By default, all three are shown.
Subscribers
The subscribers section dives into data about the people who subscribe to your products.
| Metric | Description |
|---|---|
| Started as active | The total number of active subscribers at the end of the selected date range. Please note: Some affects can affect these calculations:
|
| Ended as active | The number of active subscribers on the first day of the selected date range |
| New subscribers | The number of new subscribers during the selected date range |
| Reactivated subscribers | The number of subscribers who were active subscribers at some point during the time period, churned, and then became active again Please note: The same subscriber can be included more than once |
| Churned subscribers | The number of subscribers who went from active to churned in the selected date range. Subscribers are considered churned if they have a canceled, expired, paused, or failed (after dunning) subscription. Please note: The same subscriber can be included more than once |
Subscriptions
The Subscriptions section drills down into data about your subscription contracts.
| Metric | Description |
|---|---|
| Started as active | The total number of active subscriptions at the end of the selected date range Please note: Some events can affect these calculations:
|
| Ended as active | The number of active subscriptions at the beginning of the selected date rang |
| New subscriptions | The number of new subscriptions during the selected date range. |
| Reactivated subscriptions | The number of subscriptions that were active at some point during the time period, churned, and then became active again Please note: The same subscription can be included more than once |
| Churned subscriptions | The number of subscriptions that went from active to churned in the selected date range. Subscriptions are considered churned if they are canceled, expired, paused, or failed (after dunning). Please note: The same subscription can be included more than once |
Subscriber retention by cohort
A cohort chart is a visualization tool that tracks the behavior of a specific group (or cohort) over time. This helps analyze the retention of customers acquired within a particular period.
Subscription retention cohorts are organized by the date customers signed up for a subscription. Each cohort shows the number and percentage of subscribers who have remained active over time, with Month 0 being the month that their subscriptions were created.
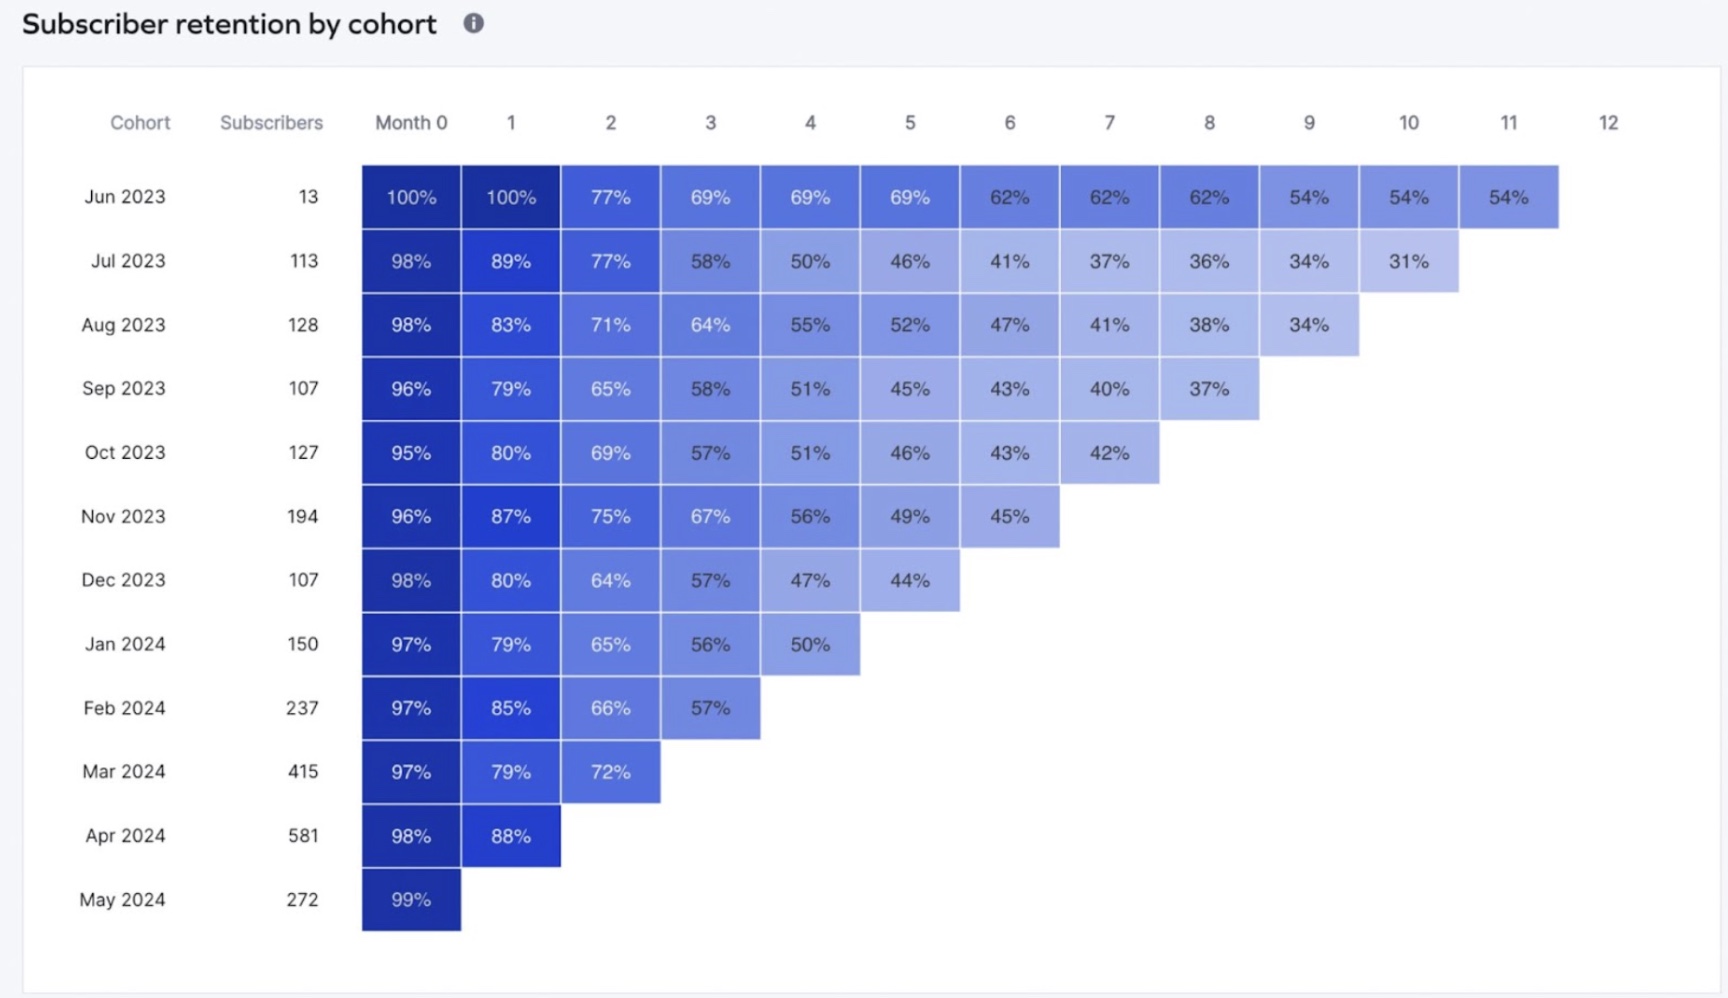
For example, in the above image, September is made of subscribers who created their subscription that month. Month 0 had a churn rate of 4%, while Month 1 had a rate of 21%, and so on.
Please note:
The cohort chart is not affected by the selected time period, and does not include migrated subscribers.
Export actions
To download a PDF of the dashboard and share findings with your team, click Export at the top of the page.
Was this article helpful?