- DarkLight
Understanding Popup A/B Testing Analytics
- DarkLight
Popup A/B Testing Analytics Overview
Popup A/B Testing Analytics gives you the tools to optimize your popups by comparing different designs and configurations. This feature helps you understand what works best for your audience, so you can make smarter, data-driven decisions to boost engagement and conversions.
Key benefits include:
Compare Performance: Test variations side by side to discover which generates more engagement or sign-ups.
Track Metrics: Monitor essential data like views, clicks, and conversions for each variation.
Gain Insights: Use detailed analytics to refine your designs and strategies for maximum impact.
With this feature, you can experiment confidently, learn what drives results, and continuously improve your marketing success.
Finding Your Popup A/B Test Analytics
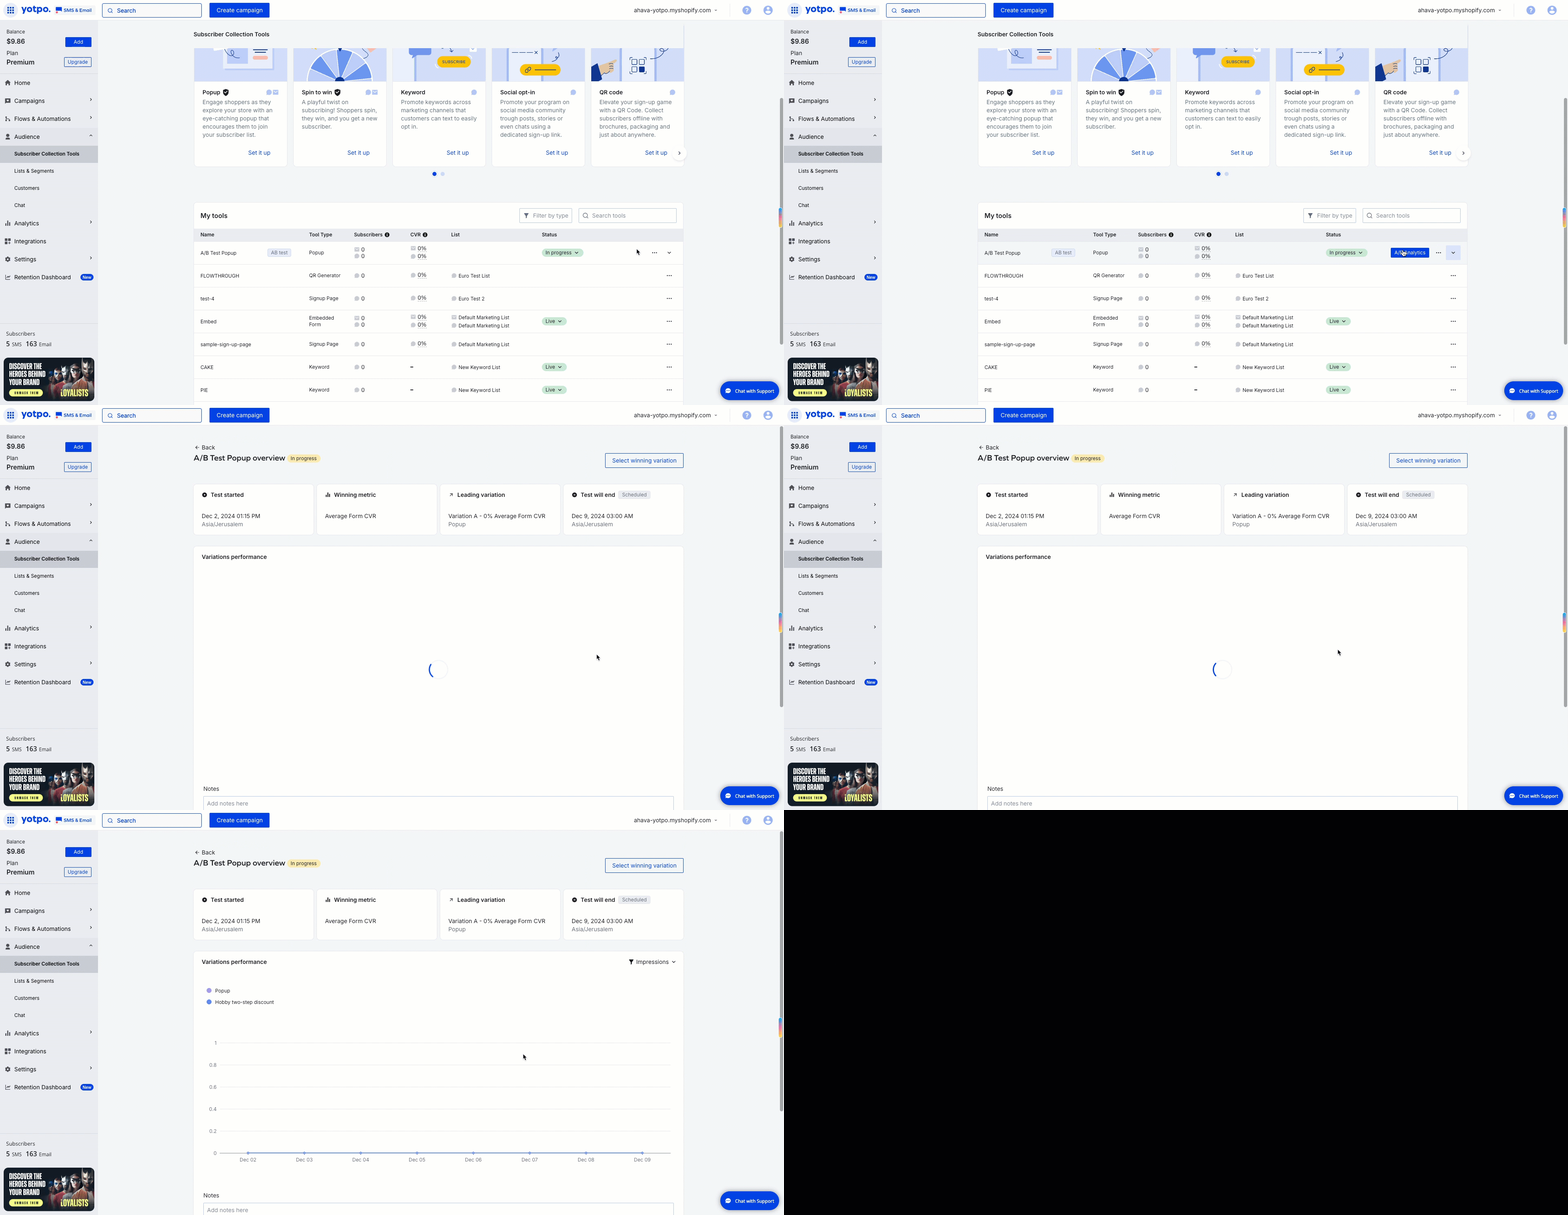
You can access analytics for each popup A/B test from the Yotpo SMS & Email main menu. Navigate to Audience > Subscriber Collection Tools, find the A/B test you want to review, and click A/B Analytics to dive into the data.
Note
If you delete a test that has been completed, you’ll no longer have access to its analytics page. Additionally, the data in the My Tools dashboard is only updated every 24 hours. For more up-to-date data, access the A/B Analytics.

Understanding your data
The analytics page of each A/B test shows data that covers the time period during which the test was in progress. It is divided into three sections - A/B test overview, Variations performance, and Detailed variations analytics. If your test is still in progress, you can click Select winning variation in the top right corner to end it.
.png)
A/B test overview
In this section, you can find a summary of your A/B test including its start and end date, the winning metric, and the leading variation.
Variations performance
The line chart allows you to filter data per metric, including impressions — the number of times a piece of content is displayed or seen by your customers.
Detailed variations analytics
This section is essentially a breakdown table allowing insight into your variations’ results. You can see:
Average CVR: The average conversion rate regardless of the channel
Average SMS & Email: The average conversion rate per channel
Revenue: The revenue generated by the variation displayed in USD
Orders: The number of orders attributed to the variation
This data helps you evaluate and refine your popup strategies effectively.


