Reviews Dashboard
- DarkLight
Reviews Dashboard
- DarkLight
Article summary
Did you find this summary helpful?
Thank you for your feedback
In this article, you'll learn how to analyze your reviews in the Reviews Dashboard.
Please note:
This dashboard reflects data collected as of January 1st 2018. Filtering by a date prior to January 1st 2018 will not return data for your search.
Accessing the Reviews Dashboard
- Log into Yotpo Reviews.
- In the main menu, click Analytics, and choose Reviews.
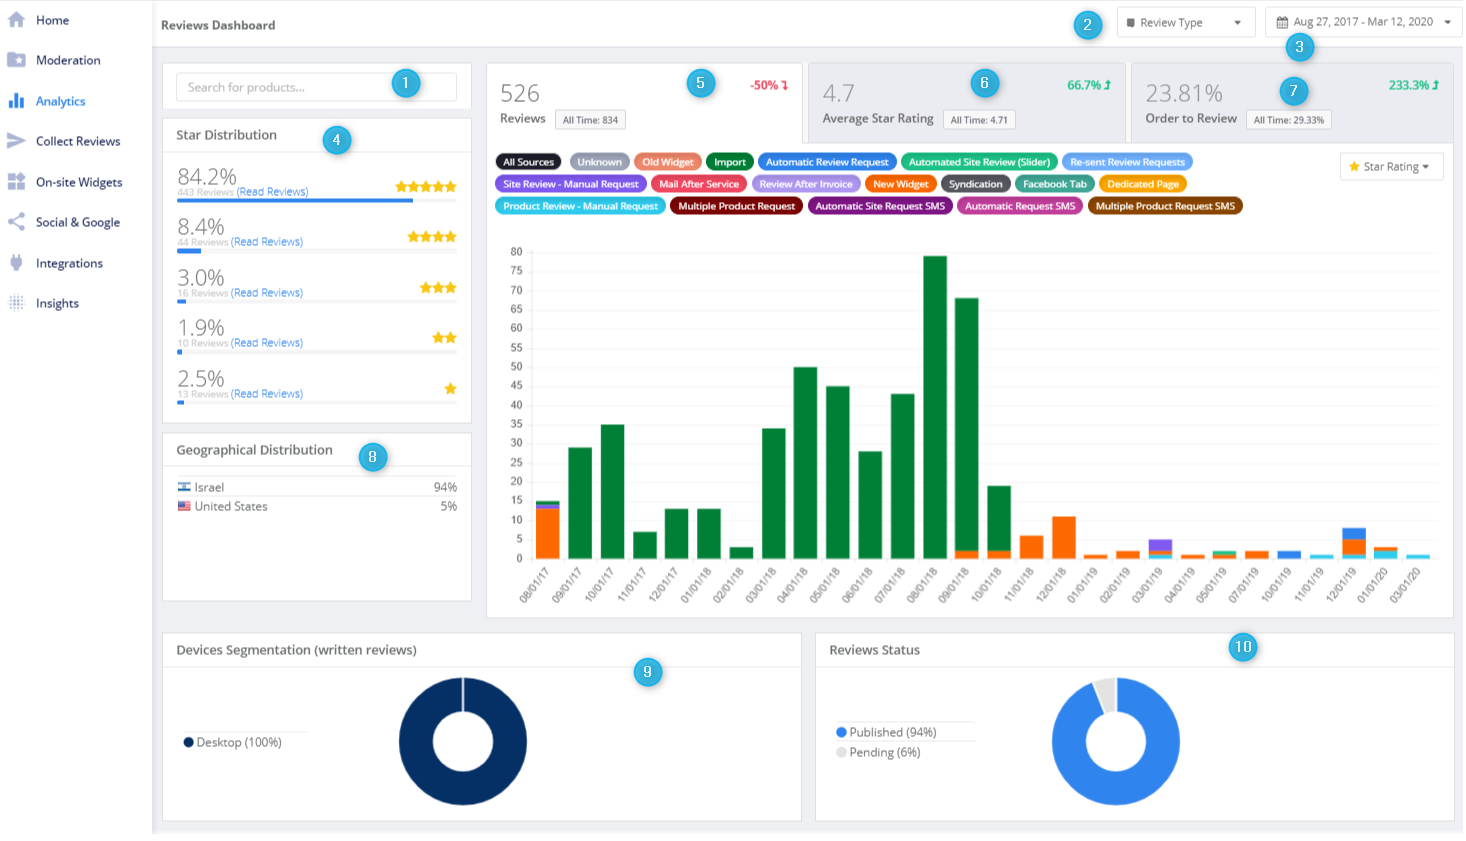
About the Reviews Dashboard
| Number | Name | Description |
|---|---|---|
| 1 | Search for Products | Search for the specific product you want to see insights for. |
| 2 | Review type | Choose the review types you want to see:
|
| 3 | Date range | Choose the range of dates for the reviews you want to see: Last 7 Days Last 14 Days Last 30 Days Last 90 Days All time since you started with Yotpo Custom range (from specific date to specific date) |
| 4 | Star Distribution | This shows reviews according to rating as both a percentage and an actual number. Click Read Reviews to show all reviews with that rating in the Moderation section. |
| 5 | Reviews | Click here to show the Reviews tab |
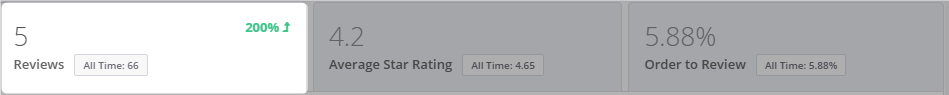
| Number of reviews in the selected date range | ||
| Number of reviews over all time since you started with Yotpo | ||
| Change over the last 30 days | ||
| 6 | Average Star Rating | Click here to show the Average Star Rating tab. |
| Average Star Rating for the selected date range | ||
| Average Star Rating over all time since you started with Yotpo | ||
| Change over the last 30 days | ||
| 7 | Orders to Reviews (see "The Orders to Review Tab" section for more info) | Click here to show the Orders to Review tab |
| Conversion Rate for the selected date range | ||
| Conversion Rate over all time since you started with Yotpo | ||
| Change over the last 30 days | ||
| 8 | Geographical Distribution | This table shows the top four review writer countries. |
| 9 | Devices Segmentation (written reviews) | This graph shows the proportion of how many reviews were written on desktop or mobile clients. |
| 10 | Reviews Status | This graph shows the proportions of published and pending reviews. |
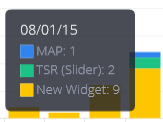
Tip:
To see the underlying information, hover over the data point with your mouse.
Optimization actions
This is one of the most exciting parts of the new Dashboard. It presents actionable items so you can get the best from Yotpo.
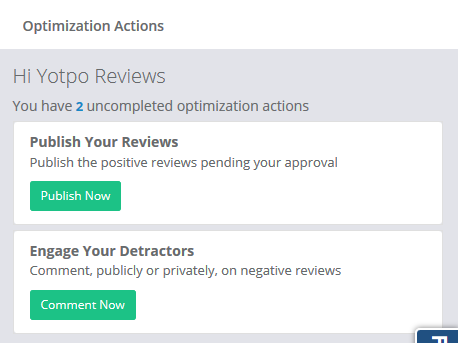
Each recommendation has an action button that will take you directly to the page in the Admin to perform the action.
| Recommendation | Action |
|---|---|
| Publish Your Reviews | Publish pending reviews in the Moderation page |
| Engage Your Detractors | Comment on one- and two-star reviews in the Moderation page. |
| Prevent Early Automatic Review Requests | Receive a CSV (comma-separated variable) list of customers who hadn't received the product when they got the Automatic Review Requests. The file contains the following information: Date purchased
|
| Increase your reviews conversion rate - add coupons | Add Coupons (Pro, Powerhouse + and Enterprise plans) |
| Set-up auto-publish to save you time | Link to Moderation to set up reviews auto-publish |
Star Distribution
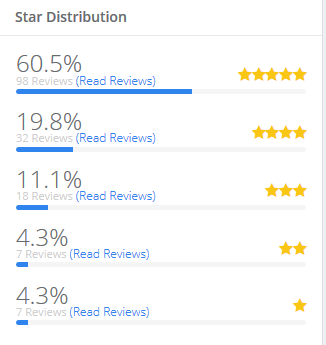
This shows reviews according to rating as both a percentage and an actual number.
Click Read Reviews to show all reviews with that rating in the Moderation section.
Geographical Distribution
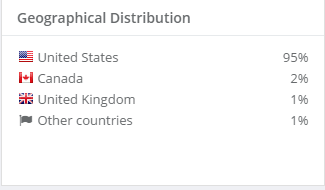
This panel shows reviews according to the country of the review writer. The top four countries are shown.
Devices Segmentation (Written Reviews)
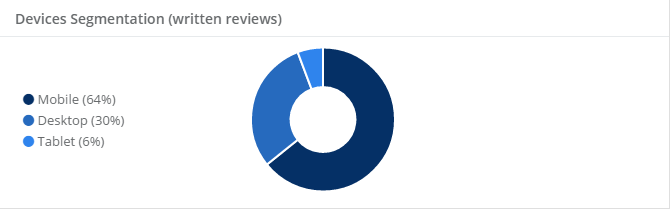
This panel shows which devices - desktop, mobile or tablet - were used to write the review.
Reviews Status
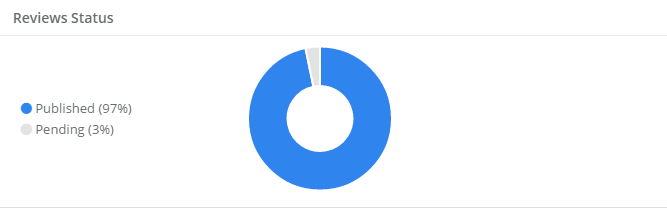
This panel shows the proportions of published and pending reviews.
Filtering by Date
| To show date for... | Select this in the Date Range drop-down menu... |
|---|---|
| The last seven days | Last 7 days |
| The last 30 days | Last 30 days |
| The last 90 Days | Last 90 Days |
| Any date | All time |
Showing results for a custom date range
To show results for a specific period:
- Select Custom Range in the Date Range drop-down menu:
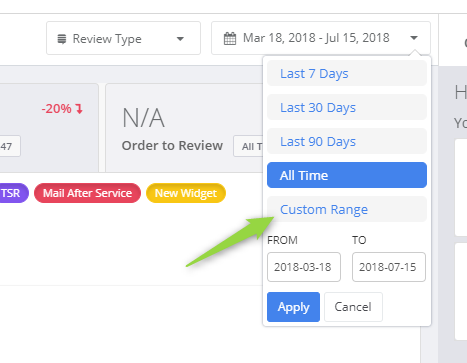
- Enter the start date in the left-hand calendar panel
- Enter the end date in the right-hand calendar panel
- Click Apply
Showing insights for a specific product
To show data for a specific product:
- Start typing the product name or product ID in the Search for products box
- Select the product from the drop-down list
The Reviews Tab
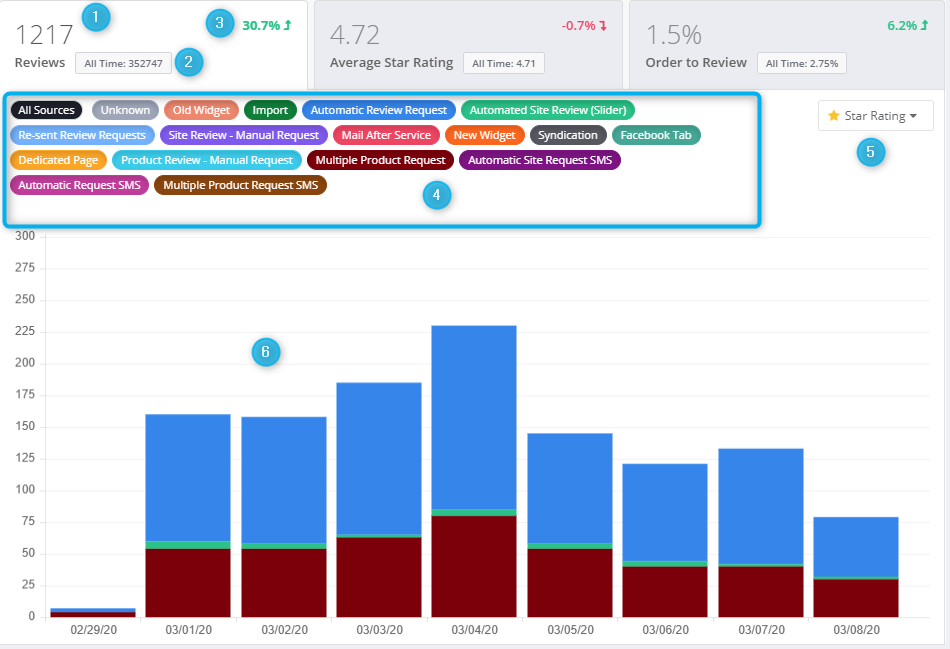
In this tab you can view the number of reviews per source and star rating over the time period you select. The data is displayed as a stack column chart, with each review source in a different color.
Accessing the Reviews tab
To access the Reviews tab:
- Click here:
- The Reviews tab will open
The Reviews Tab Interface
| Number | Name | Description |
|---|---|---|
| 1 | Number of reviews in the selected date range | |
| 2 | Number of reviews over all time | |
| 3 | Change over the last 30 days | |
| 4 | Reviews Source | Click the button to select the review source:
|
| 5 | Star Rating | Choose the star rating(s) for the reviews to see:
|
| 6 | Results graph | This graph shows the number of reviews based on the criteria you selected. The colors used are the same as the filter buttons. The timescale on the x axis changes according to the date range you select: Last 7 days: Day Last 30 days: Day Last 90 days: Week All Time: Month Custom Range: Depends on the custom range |
Filtering by Reviews Source
To filter the results by the reviews source:
- Click the source button to show or hide the source.
- The graph is updated.
Tip:
The All Sources button toggles between all sources and no sources.
Filtering by Star Rating
To filter the results by the Star Rating, select or unselect the checkbox for the Star Rating in the Star Rating drop-down menu.
Tip:
The All Stars checkbox toggles between all Ratings and no Ratings
The Average Star Rating Tab
Accessing the Average Star Ratings Tab
To access the Average Star Ratings tab:
- Click here:

- The Average Star Ratings tab will open
The Average Star Rating Interface
| Number | Name | Description |
|---|---|---|
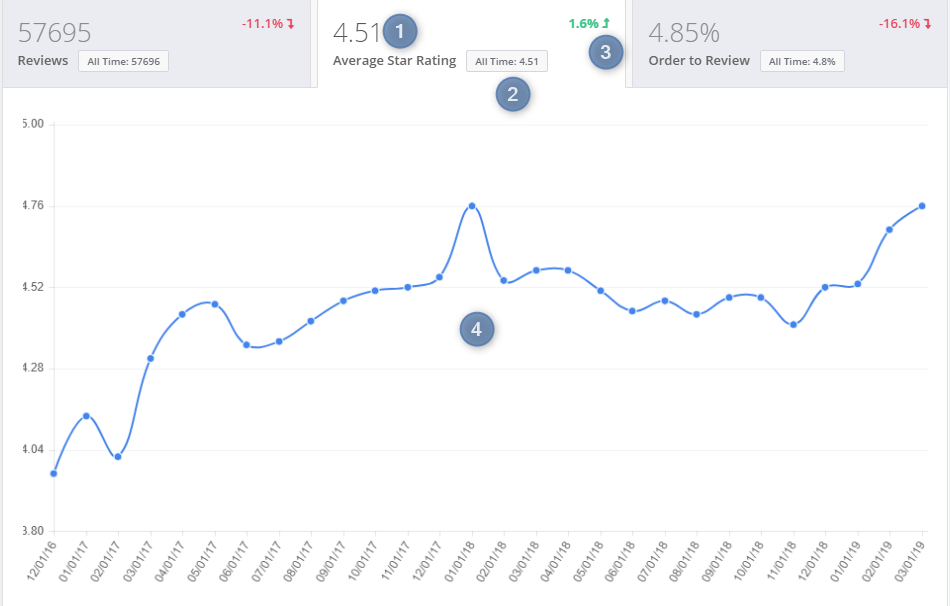
| 1 | Average Star Rating for the selected date range | |
| 2 | Average Star Rating over all time | |
| 3 | Change over the last 30 days | |
| 4 | Results graph | This graph shows the average star rating for the time period you selected. The timescale on the x axis changes according to the date range you select: Last 7 days: Day Last 30 days: Day Last 90 days: Week All Time: Month Custom Range: Depends on the custom range |
The 'Orders to Review' Tab
The overall conversion rate, from email to review, is calculated from Automatic Review Requests, Manual Site Review Requests, Multiple Review Request forms, Site Reviews After Service, Site Reviews After Invoice, and Manual Product Review Request emails.
Orders to review rate for Automatic Review Requests is calculated differently based on the percent of orders that result in at least one review written.
If you have configured Smart Reminder emails or Bulk Purchase Settings (AKA you send multiple emails from a single order), Yotpo reports on whether the buyer writes a review or not for an order. We do not show conversion rate per Automatic Review Request email sent.
To illustrate with an example: an order containing two items was made on your site, and you send an Automatic Review Request and reminder email for each item (the customer gets 4 review request emails for the order). The customer ultimately writes a review on one of the products from a reminder email. Your conversion rate on that order is 100% since you were able to generate content for that order.
Accessing the 'Orders to Review' Tab
To access the 'Orders to Review' tab:
- Click here:

- The 'Orders to Review' tab will open
The 'Orders to Review' Tab Interface
Please Note:
The Reviews Dashboard represents reviews from single product orders as Automatic Review Requests and reviews from the Multi-Product Form as Multi-Product Review Request
| Number | Name | Description |
|---|---|---|
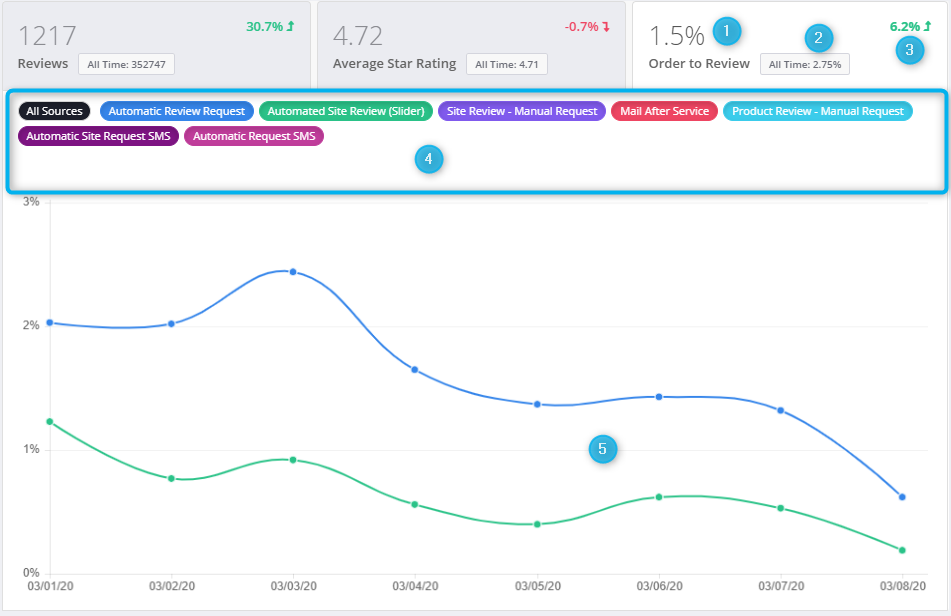
| 1 | Average conversion rate for the selected date range | |
| 2 | Average conversion rate over all time | |
| 3 | Change over the last 30 days | |
| 4 | Reviews Source | Click the button to select the source:
|
| 5 | Results graph | This graph shows the average star rating for the time period you selected. The timescale on the x axis changes according to the date range you select: Last 7 days: Day Last 30 days: Day Last 90 days: Week All Time: Month Custom Range: Depends on the custom range |
Filtering by Source
To filter the results by the source:
- Click Source to show or hide the source
Tip:
The All Sources button toggles between all sources and no sources
Was this article helpful?