Conversion Dashboard
- DarkLight
Conversion Dashboard
- DarkLight
Article summary
Did you find this summary helpful?
Thank you for your feedback
Yotpo assets such as the Reviews Widget or Visual UGC Gallery increase visitor interactions with your store and convert more of these interactions to sales. Optimize your Yotpo deployment and maximize ROI using the key performance metrics provided in the Conversion Dashboard.
In this article, you'll learn how to track your conversion data using the Conversion Dashboard.
How it works
You can use the metrics listed below to track data through the sales process and make well-informed data-driven decisions - from the first impression, through conversion, to sale:
- Percentage of site visitors who view the Reviews Widget
- Increase in conversion rate from visitors who engage with on-site assets compared to visitors who don’t engage
- Percentage of sales that interacted with each on-site widget
- Traffic coming to your site from Email Upsells
- Revenue from coupons
- Time spent on site by visitors who engage with user-generated content
- Percentage of visitors on your site look at customer photos
By comparing the numbers for engagement and sales, you can see which Yotpo assets are the most effective. The conversion data shows how effective Yotpo is in converting visitors to customers.
Before you start
Before you use the dashboard, make sure you Install Conversion Tracking. Click here for instructions.
Important to know:
- Given market changes with browser privacy and cookie tracking, data may be partial in the Conversion Dashboard.
- Some users will have data missing from their dashboards up until January 3rd, 2017. In such cases, we recommend filtering your data beginning January 3rd.
Accessing the Conversion Dashboard
To view the Conversion Dashboard in Yotpo Reviews, go to Analytics > Conversion.
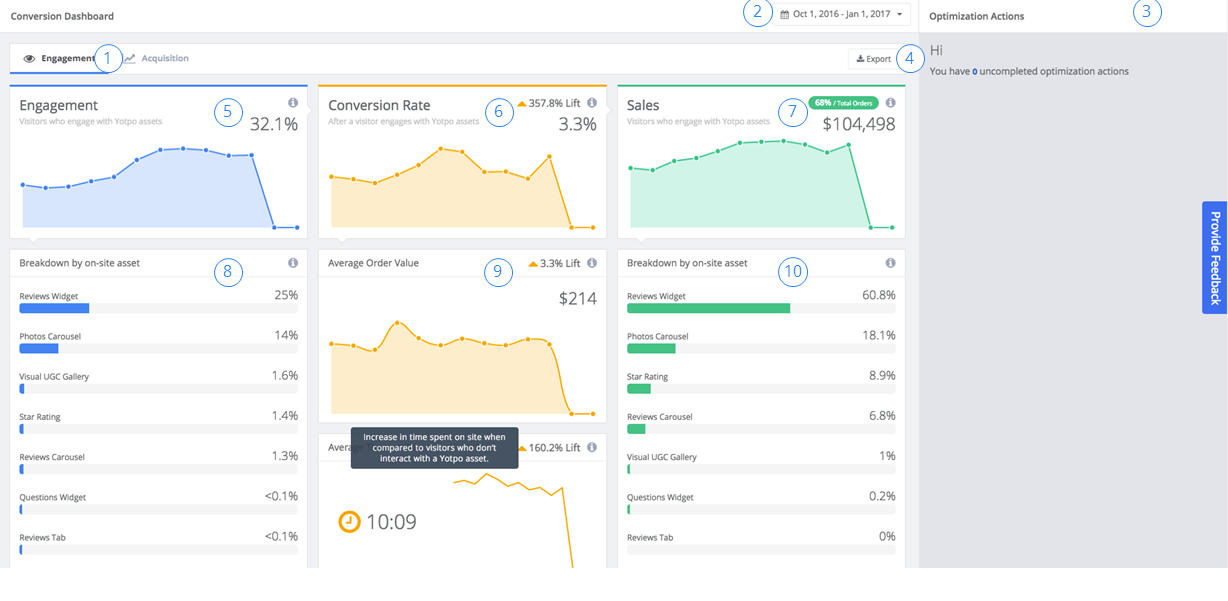
Viewing engagement data
There are two tabs in the Conversions Dashboard - Engagement and Acquisition. Engagement describes the visitors who interact with on-site Yotpo assets, such as the Reviews Widget or Photos Carousel. The dashboard highlights their behavior in terms of *average order value, conversion rate, and time on site compared to visitors who don’t engage with Yotpo assets.
It also shows the dollar value of sales associated with these visitors.
*Currently, Yotpo only supports USD for AOV Calculations. If your store uses a different currency, the AOV is not shown
Please note:
If you have successfully installed the Yotpo Conversion Tracking Javascript and your Conversion Dashboard is still not populated with data, please allow more time for a larger data set to accumulate
| Item | Name | Description |
|---|---|---|
| 1 | Tab | Select Engagement or Acquisition dashboard |
| 2 | Date range | Select the date range to display for the data |
| 3 | Optimization Actions | Suggested actions to get the best from Yotpo |
| 4 | Export | Export all the detailed data in the dashboard, broken down by week, as a CSV file. |
| 5 | Engagement | The percentage of visitors to your site who have interacted with a Yotpo asset divided by the total visitors to your site. An interaction can be either a click or view, depending on the widget. See below for details. |
| 6 | Conversion Rate Uplift | Increase in conversion when compared to visitors who don’t interact with a Yotpo asset. This shows how much more likely a visitor who engages with customer content is to buy as compared to a visitor who doesn’t engage with customer content. If no number is shown, then the uplift is not statistically significant. |
| 7 | Sales | Sales from visitors who interacted with Yotpo assets. This value is an estimate calculated by multiplying the percentage of total orders (#) from customers that engage with a Yotpo asset by your total sales ($) for the given time period. % / Total Orders: The percentage of total orders that came from visitors who interacted with a Yotpo asset. This value is an estimate calculated by multiplying the percentage of total orders (#) from customers that engage with a Yotpo asset by your total sales ($) for the given time period. Note: This figure is an estimate. |
| 8 | Engagement Breakdown by asset | Visitors who engage with each of the following Yotpo assets out of total visitors to your site. This metric shows you which Yotpo assets are the most visible on your site. Based on these metrics, you can rearrange assets to increase their exposure. A visitor can engage with more than one asset while in your store: Asset - engagement type Reviews Widget - viewed, clicked (Including Promoted Products) Photos Carousel - viewed, clicked Visual UGC Gallery - viewed, clicked Star Rating - clicked Q&A Widget - viewed, clicked Reviews Carousel - clicked Reviews Tab - clicked Note: You only see data for assets that are included in your plan. See our pricing page for more information. |
| 9 | Breakdown by conversion type | Conversion Rate: Visitor conversion rate after engaging with a Yotpo on-site asset. Conversion Rate Uplift: Increase in conversion when compared to visitors who don’t interact with one Yotpo asset. Most likely to purchase Average order value: Average order value of visitors who engage with one Yotpo asset. Average order value Uplift: Average order value uplift compared to visitors who didn’t interact with Yotpo assets. Avg time on site: Time spent on site by visitors who engage with one Yotpo asset. Avg time on site Uplift: Increase in time spent on site when compared to visitors who don’t interact with a Yotpo asset. This shows how much more time a visitor who engages with customer content spends on-site as compared to a visitor who doesn’t engage with customer content. |
| 10 | Sales Breakdown by asset | Sales broken down by Yotpo asset (widget): Reviews Widget (including promoted products) Q&A Widget Photos Carousel Star Rating Visual UGC Gallery Reviews Carousel Reviews Tab Note: You only see data for assets that are included in your plan. See our pricing page for more information. |
The Engagement dashboard shows the percentage of visitors to your site who have interacted with a Yotpo asset divided by the total visitors to your site. An interaction can be either a click or a view, depending on the widget type.
The conversion and sales data are recorded if a customer interacted and purchased in the last 24 hours. Sessions of less than five seconds are not tracked.
Please note:
When it comes to Multiple Product Review emails, The dashboard will display a conversion if at least one product is reviewed via the Multi-Product Form.
One of the best takeaways you can get from the dashboard is to compare the percentage here with the percentage under Engagement for a specific Yotpo asset.
- If an asset has a low engagement percentage but a high Sales percentage, that means it’s a highly effective asset and you should give it more exposure.
- If an asset has a high engagement percentage but a low sales percentage, it means that visitors are seeing it but not purchasing, and you should rethink its location on your site.
Viewing acquisition data
This tab shows direct traffic and sales from links in Yotpo-powered marketing channels such as email upsells, social posts and coupons.
Use the data to see which Yotpo marketing channels have the most visitors and which generate the most revenue. By comparing the traffic and revenue data, you can see which channels are the most effective.
For example, you may want to invest more resources in the channels that are bringing the most revenue per visitor, taking the cost of each channel into account.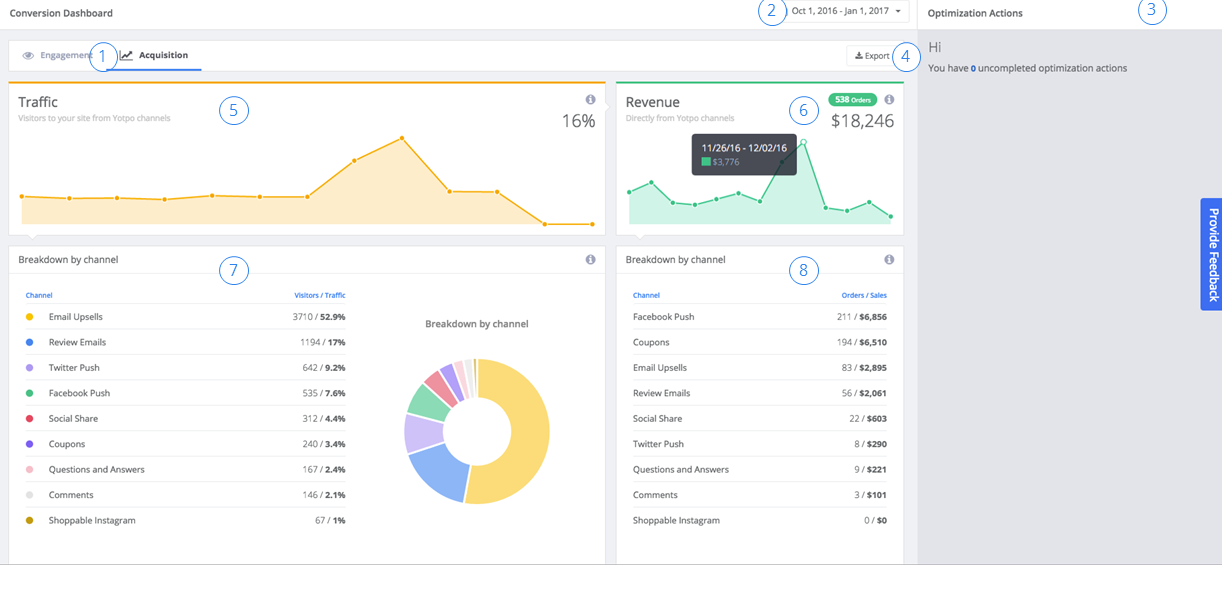
| Item | Name | Description |
|---|---|---|
| 1 | Tab | Select Engagement or Acquisition dashboard |
| 2 | Date range | Select the date range to display for the data |
| 3 | Optimization Actions | Suggested actions to get the best from Yotpo |
| 4 | Export | Export all the detailed data in the dashboard, broken down by week, as a CSV file. |
| 5 | Traffic | Total visitors coming to your site from each of the following Yotpo marketing channels: Review Emails - Traffic from links in review emails such as product name or store logo. (Not including traffic from Email Upsells.) Facebook Push - Traffic from social push posts on Facebook. Email Upsells - Traffic from Email Upsells (Promoted Products) within any Yotpo powered email. Comments - Traffic from comments notification emails. Coupons - Traffic from coupons notification emails. (Note: to be counted the customer doesn't have to use the coupon) Twitter Push - Traffic from social push posts on Twitter. Questions and Answers - Traffic from Q&A emails to potential customers and past buyers. Shoppable Instagram - Traffic from Shoppable Instagram. Social Share - Traffic from social review posts shared by your customers. Note: Increased traffic from SEO & paid ads is not included in this metric Note: You only see data for assets that are included in your plan. See our pricing page for more information. |
| 6 | Revenue | The total revenue you made directly from Yotpo marketing channels. This figure is the amount of money spent by the traffic from Yotpo marketing channels. |
| 7 | Traffic breakdown by channel | Breakdown of visitors brought through a Yotpo marketing channel: Review Emails - Traffic from links in review emails such as product name or store logo. (Not including traffic from Email Upsells.) Facebook Push - Traffic from social push posts on Facebook. Email Upsells - Traffic from email upsells within any Yotpo-powered email. Comments - Traffic from comments notification emails. Coupons - Traffic from coupon notification emails. (Note: To be counted the customer doesn't have to use the coupon) Twitter Push - Traffic from social push posts on Twitter. Questions and Answers - Traffic from Q&A emails to potential customers and past buyers. Shoppable Instagram - Traffic from Shoppable Instagram. Social Share - Traffic from social review posts shared by your customers. Note: You only see data for assets that are included in your plan. See our pricing page for more information. |
| 8 | Revenues breakdown by channel | Breakdown of orders (#) and sales ($) brought through each Yotpo marketing channel. The revenues are attributed to the last traffic source the customer engaged with. Review Emails - Orders & sales from links in review emails such as product name or store logo. (Not including traffic from Email Upsells.) Facebook Push - Orders & sales from social push posts on Facebook. Email Upsells - Orders & sales from email upsells within any Yotpo-powered email. Comments - Orders & sales from comments notification emails. Coupons - Orders & sales from coupon notification emails. (Note: To be counted the customer doesn't have to use the coupon) Twitter Push - Orders & sales from social push posts on Twitter. Questions and Answers - Orders & sales from Q&A emails to potential customers and past buyers. Shoppable Instagram - Orders & sales from Shoppable Instagram. Social Share - Orders & sales from social review posts shared by your customers. Note: You only see data for assets that are included in your plan. See our pricing page for more information. |
FAQ:
Get answers to frequently asked questions about the Conversion Dashboard's Engagement and Acquisition analytics here
Was this article helpful?